The dashboard is the headline view: the four numbers a CFO checks first, for the version and entity you choose — no report to build.
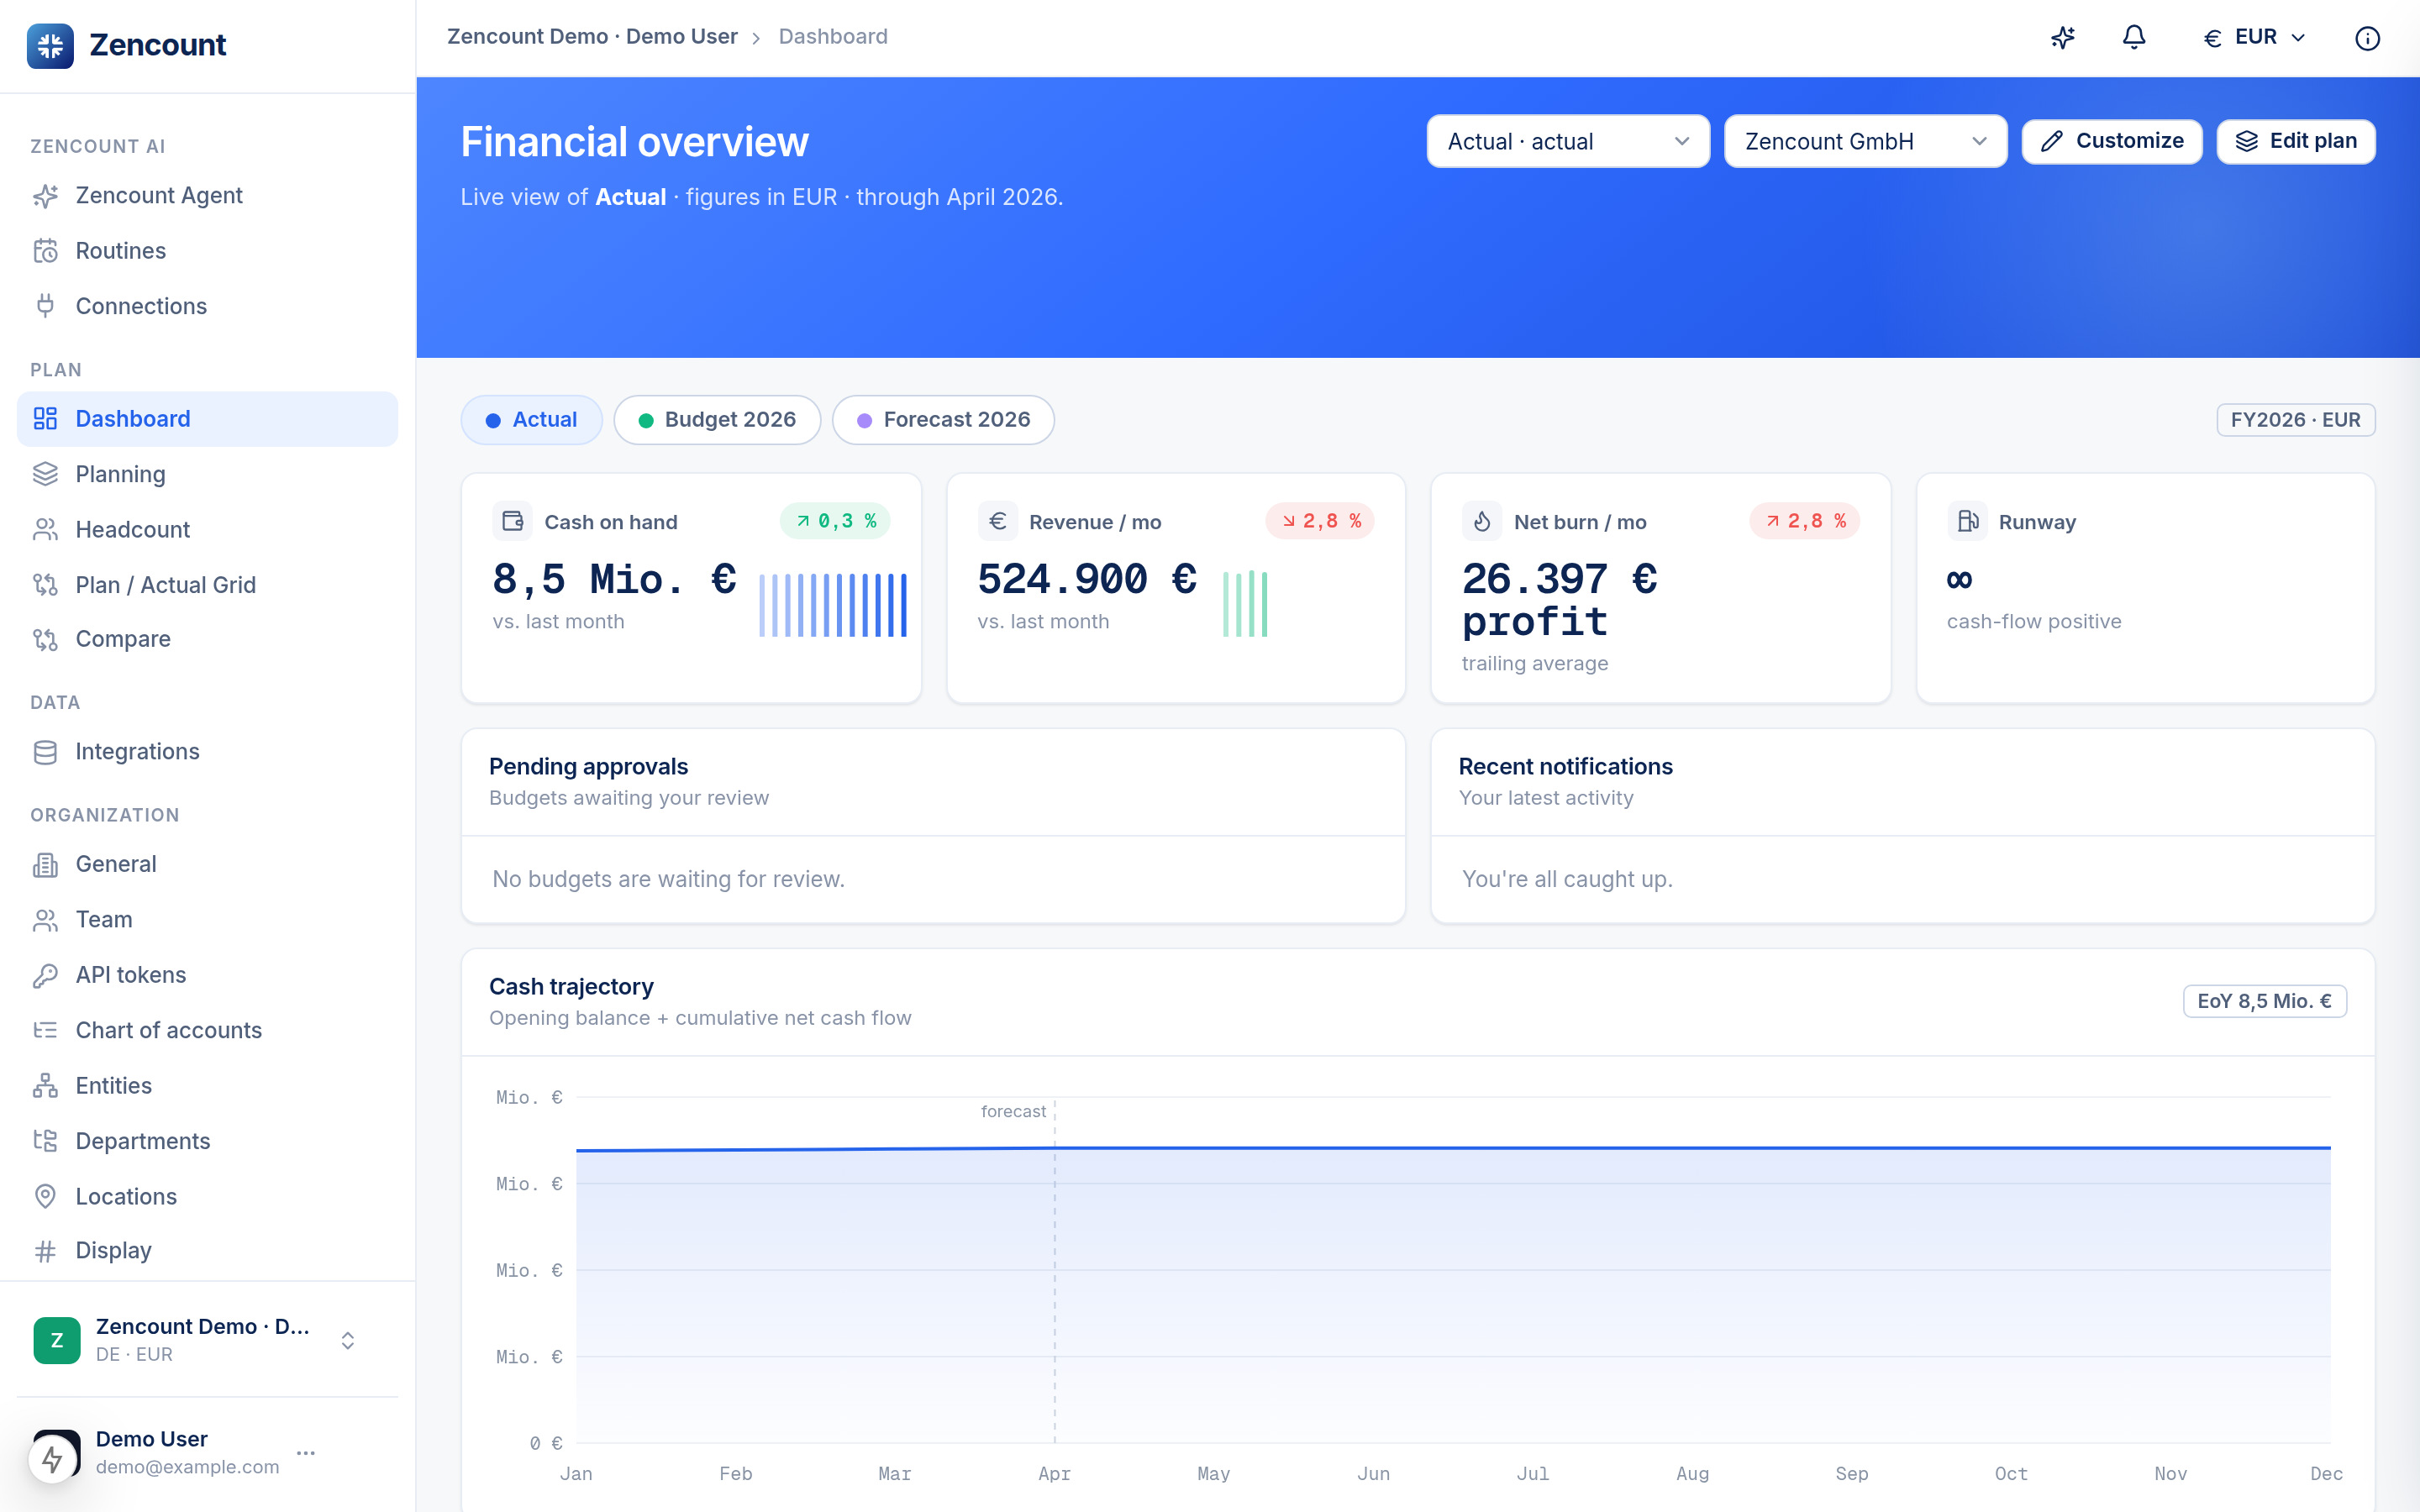
The four KPIs
- Cash on hand — your latest cash position, with the change vs. last month.
- Revenue / mo — current monthly revenue and its trend.
- Net burn / mo — monthly cash burn (or “profit” when you’re cash-flow positive).
- Runway — months of cash left at the trailing burn (∞ when profitable).
Version × entity
The pickers at the top set which story the dashboard tells — read your Budget for the plan, your Actual for reality, or a single entity instead of the whole group.
The cash trajectory chart projects opening balance + cumulative net cash to end-of-year, so you can see the runway, not just today’s balance.
Next steps
- Adjust the plan and watch these update.
- Connect a data source to feed Actuals.