The Plan / Actual grid lays every account across the months of the year. It’s the view for a monthly review: scan the variance column, find the outlier, drill in.
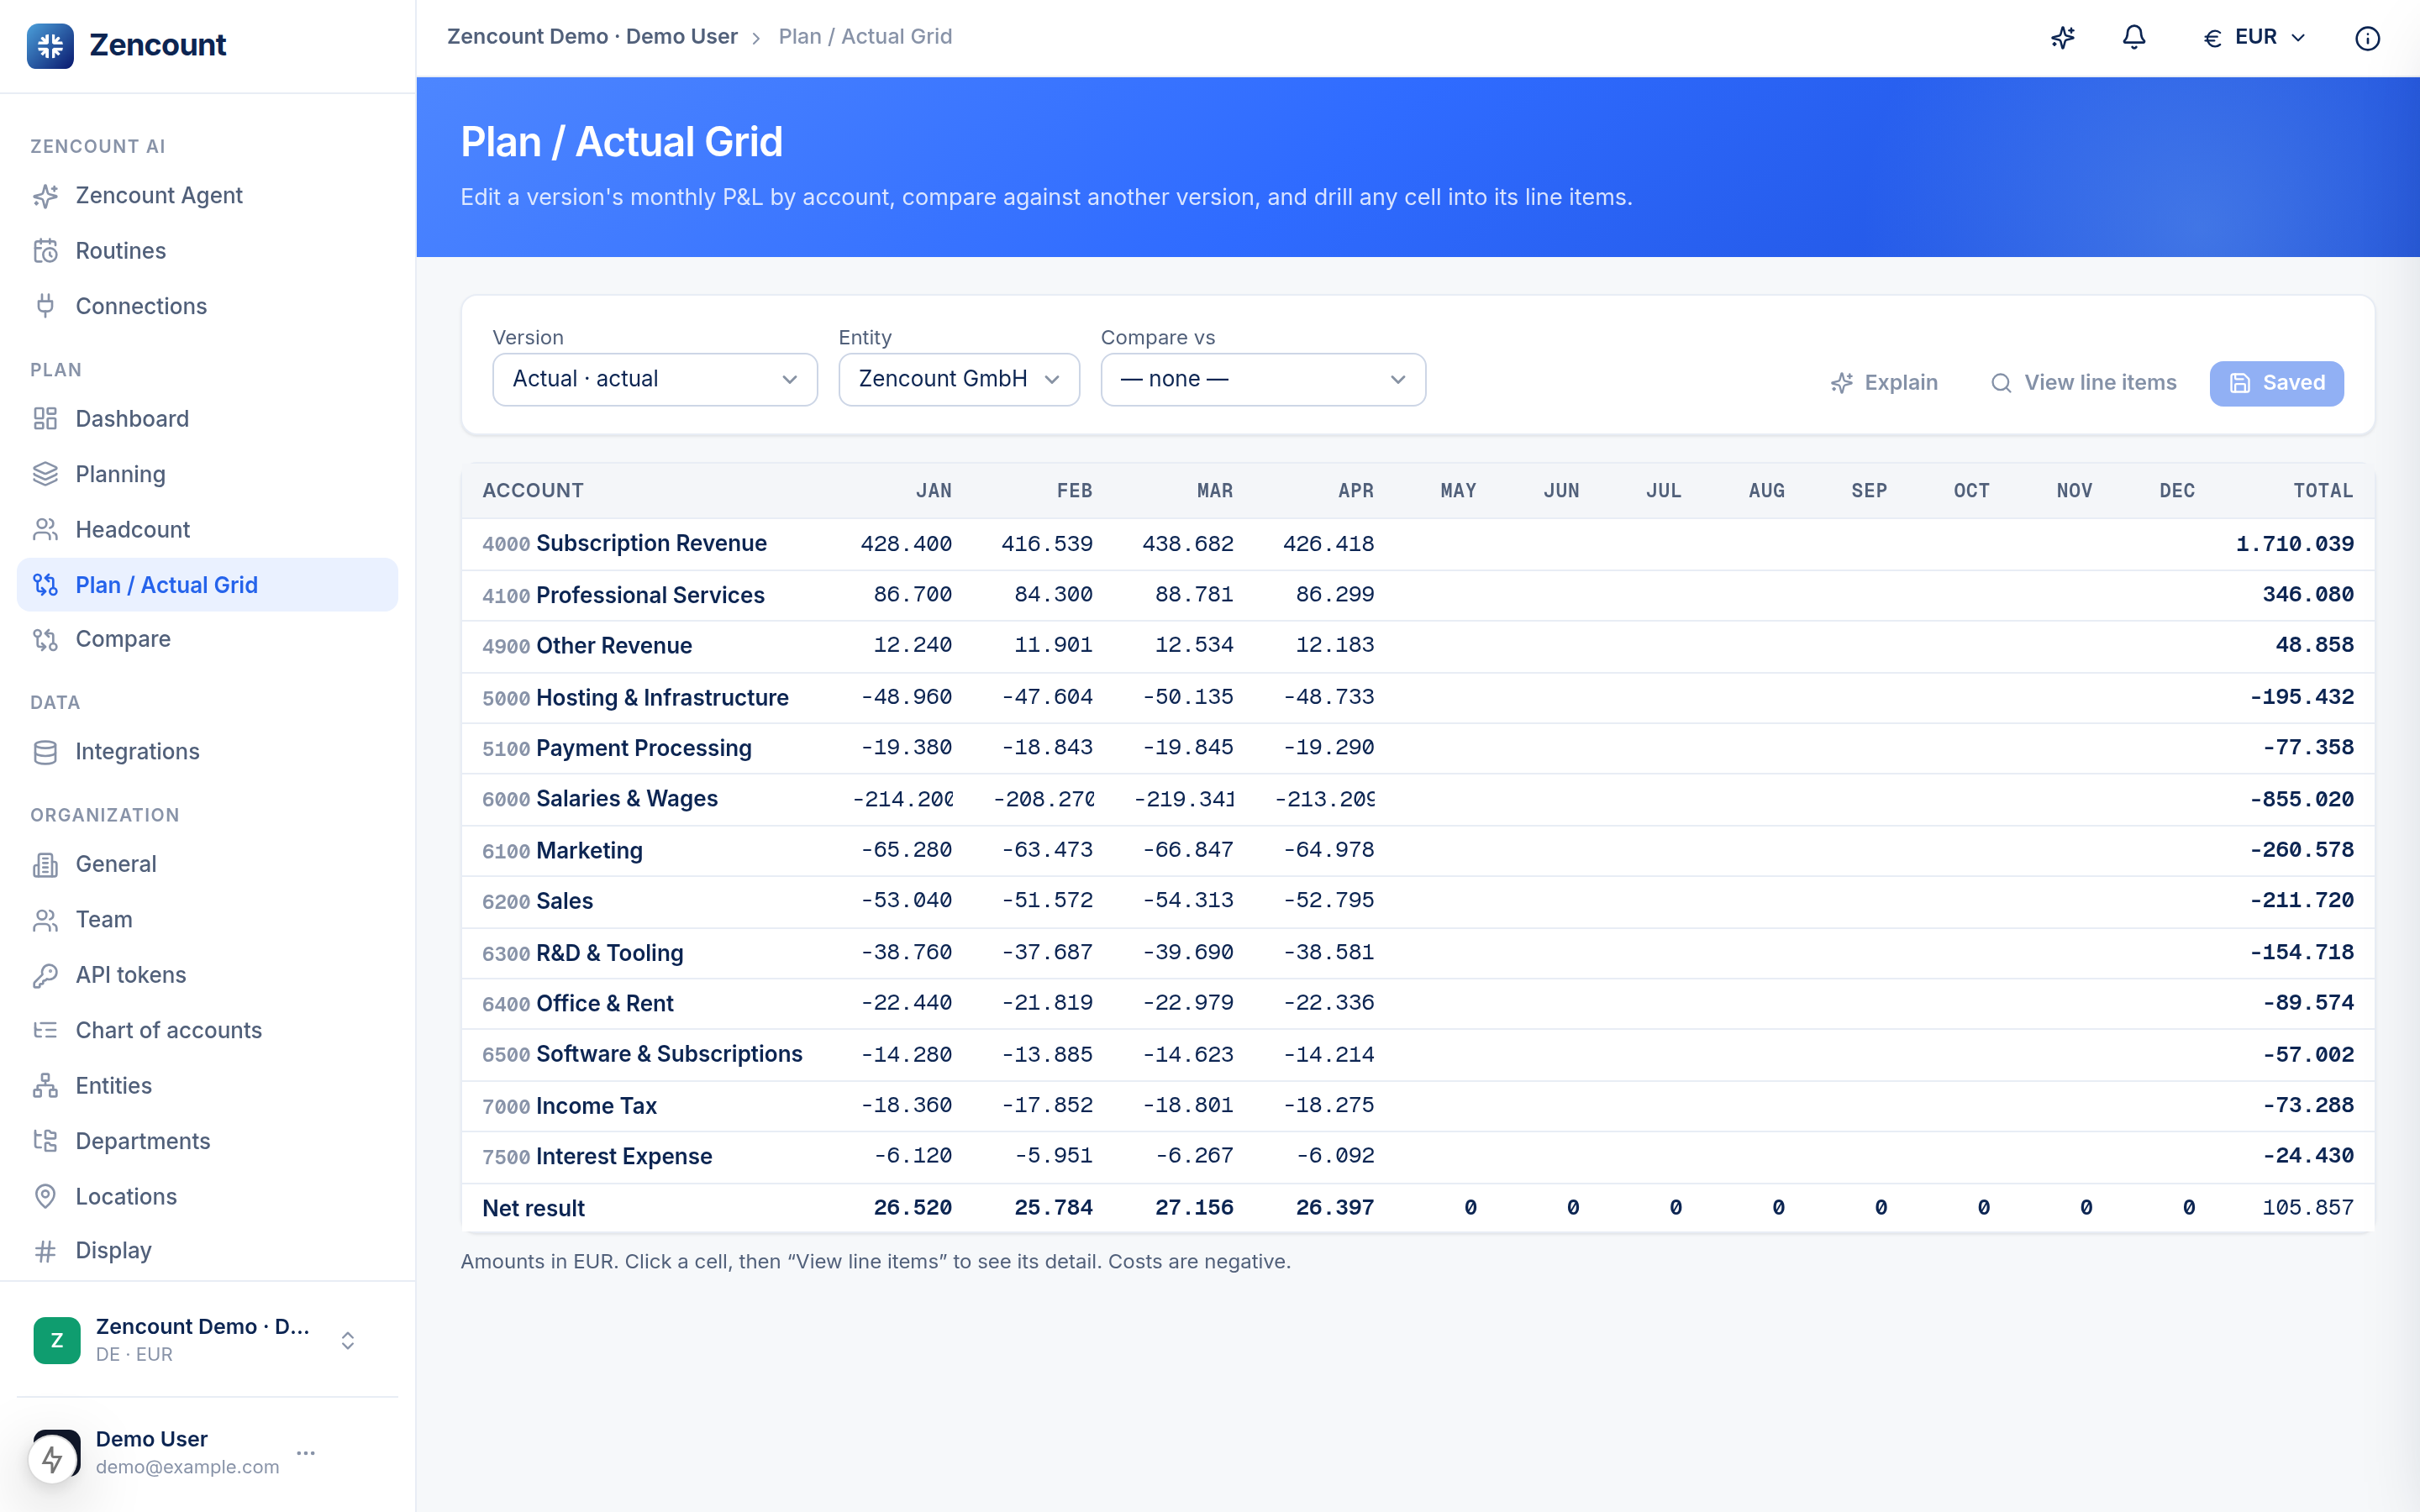
Set a comparison
Pick a base version and a comparison version. Each row then shows the variance against your baseline (e.g. Actual vs. last Forecast), inline.
Drill to the evidence
Click any aggregate cell to open the line items behind it — GL documents for actuals, planned positions for a plan. The sum of the lines always equals the cell.
Traceability is native: every number can be defended down to its source documents — useful for the board and for an audit.
Next steps
- Compare two versions side by side.
- Connect a data source to fill your Actuals.