The whole point of keeping plan and actuals in one model is that you can lay any two versions side by side and read the difference instantly — no exports, no re-mapping.
Compare two versions
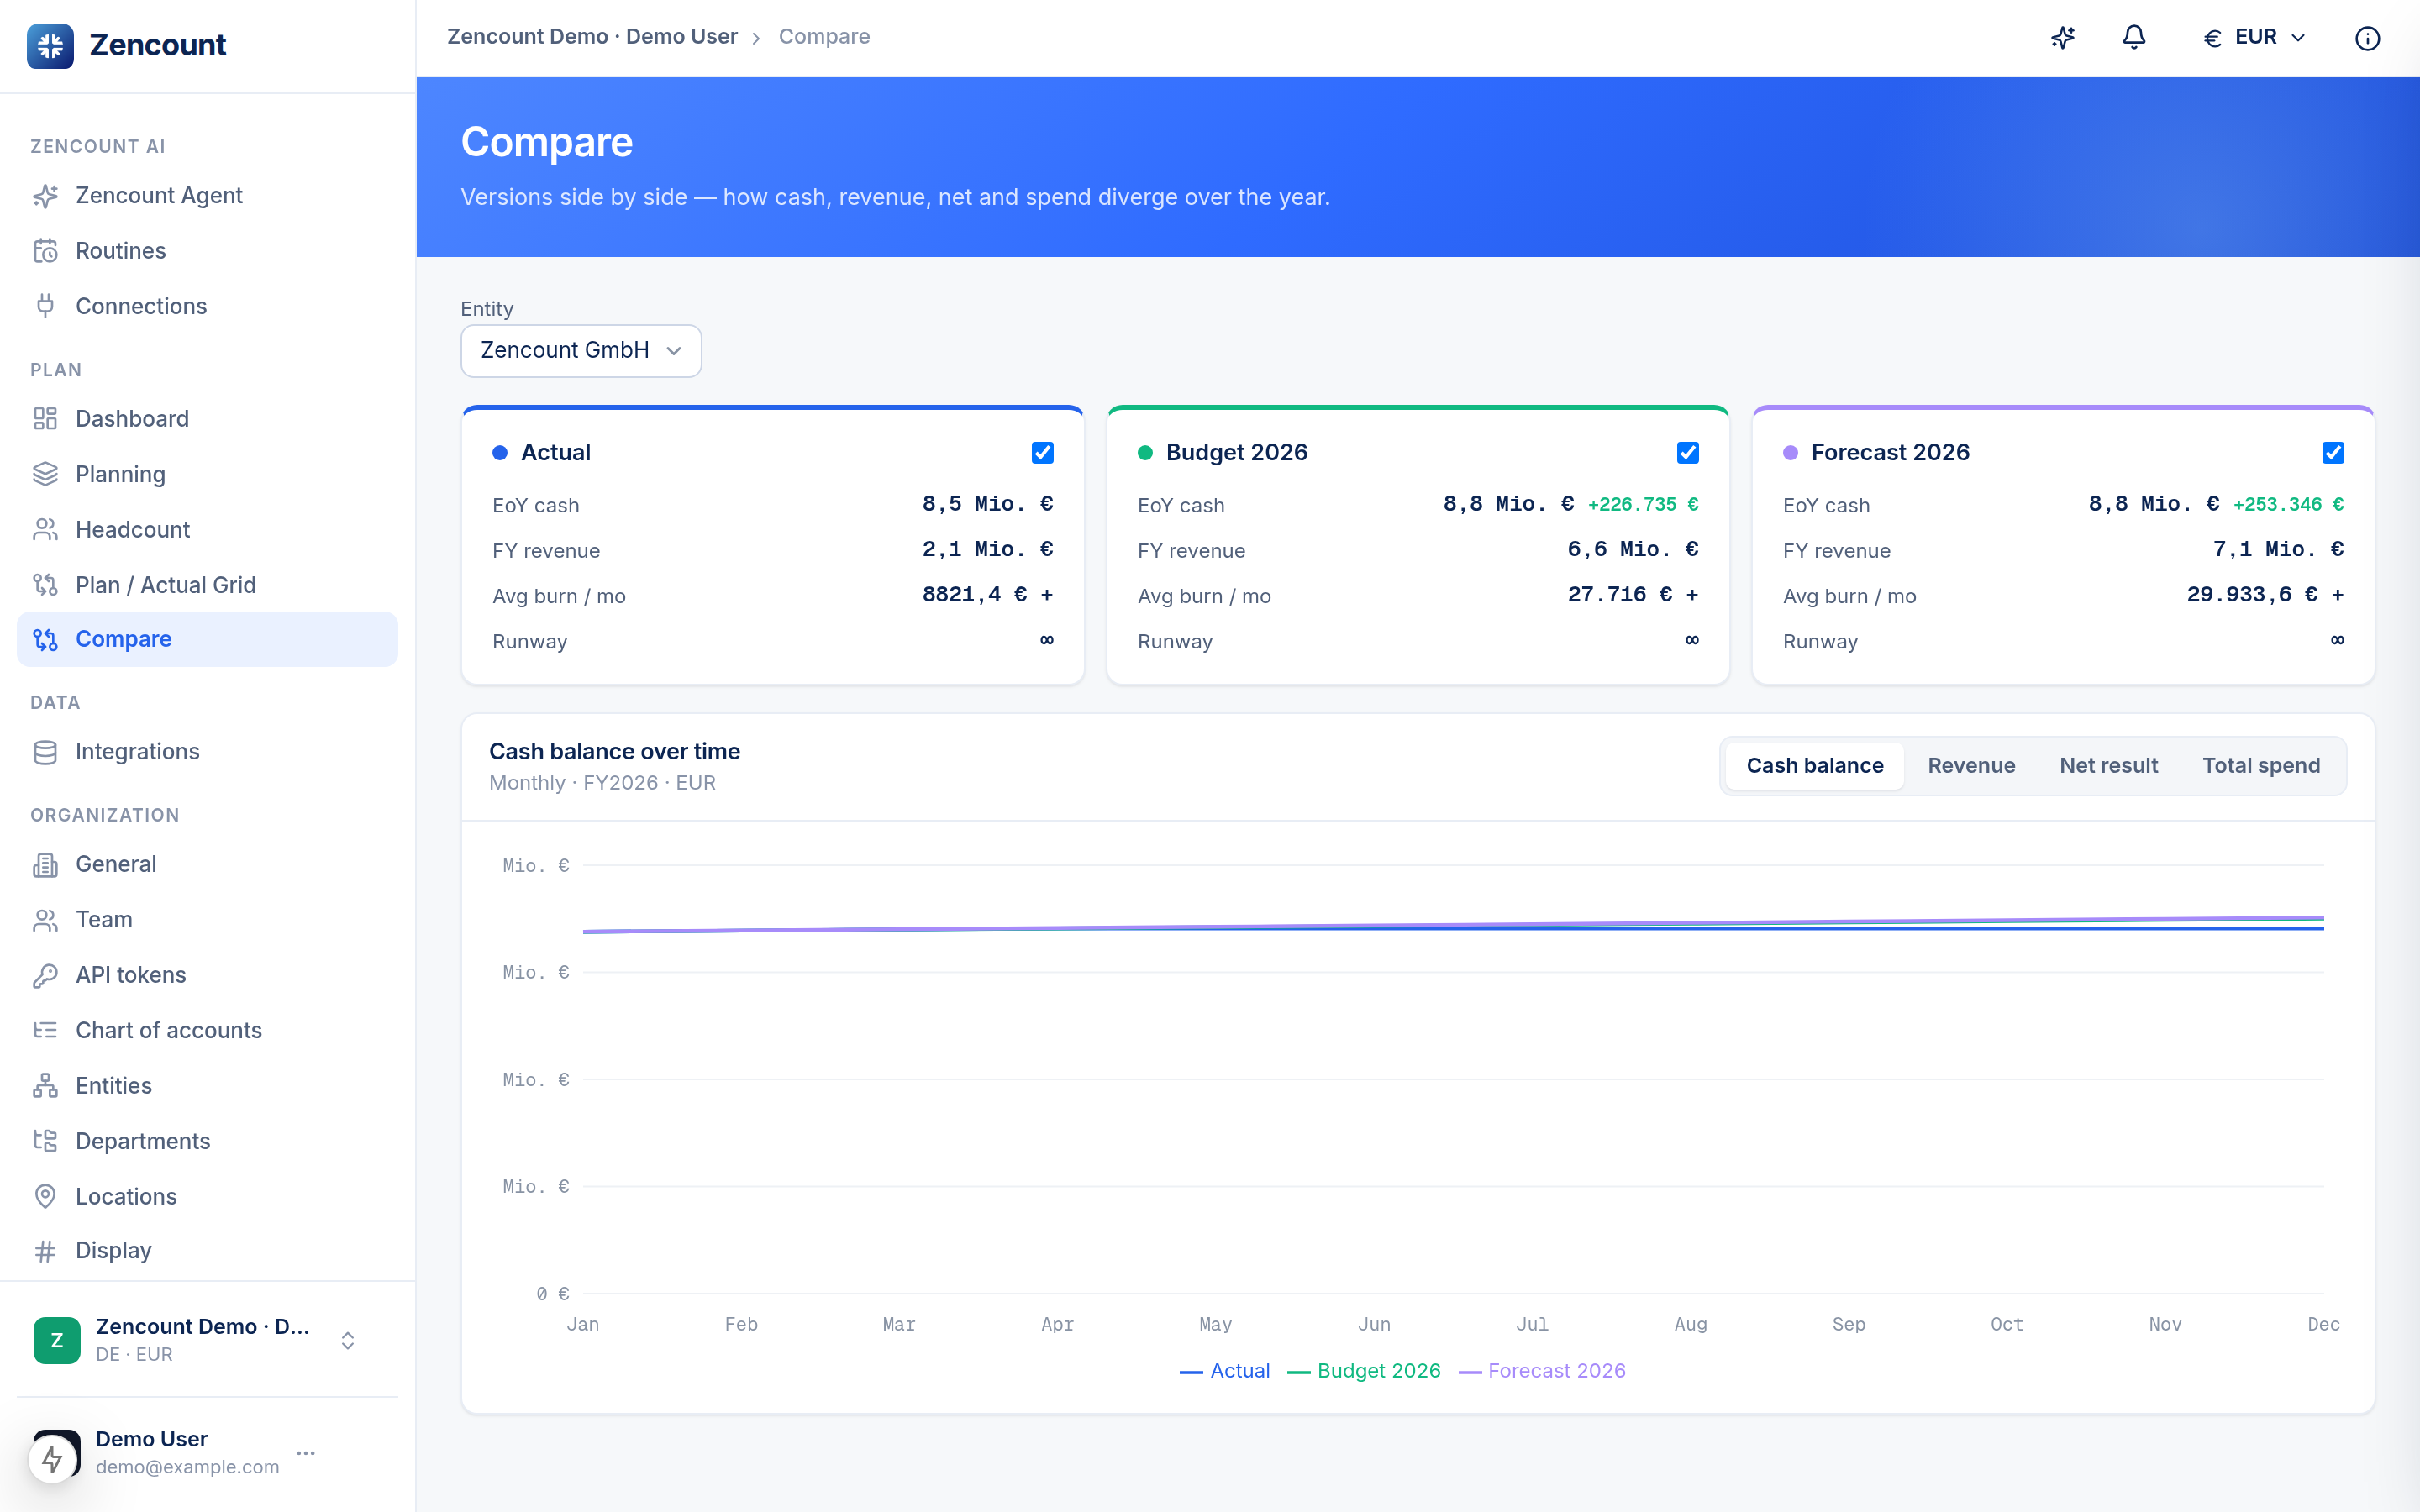
- Open Compare from the sidebar.
- Pick a base version and a comparison version — for example FY26 Budget vs. Q2 Forecast.
- Each P&L row shows both values and the variance between them, so you can scan straight to where you’re betting (or bleeding).
Read variance inline in the grid
If you’d rather stay in the matrix grid, set its comparison version and the delta appears in-line per row against your chosen baseline (e.g. last forecast) — handy for a monthly review.
Drill any number to its evidence
Every aggregate cell is traceable. Click a number to open the line items behind it — GL documents for actuals, planned positions for a plan. The sum of the lines always equals the cell, so you can defend any figure to the board or an auditor.
Traceability is native, not an export: the aggregate ↔ line-item link is a first-class relationship in the model.
Next steps
- Create your first plan if you don’t have a second version yet.