Your chart of accounts is the backbone of every version — it’s what gives the planning grid its grouped P&L shape. New workspaces start with a sensible default you can adjust.
How accounts group
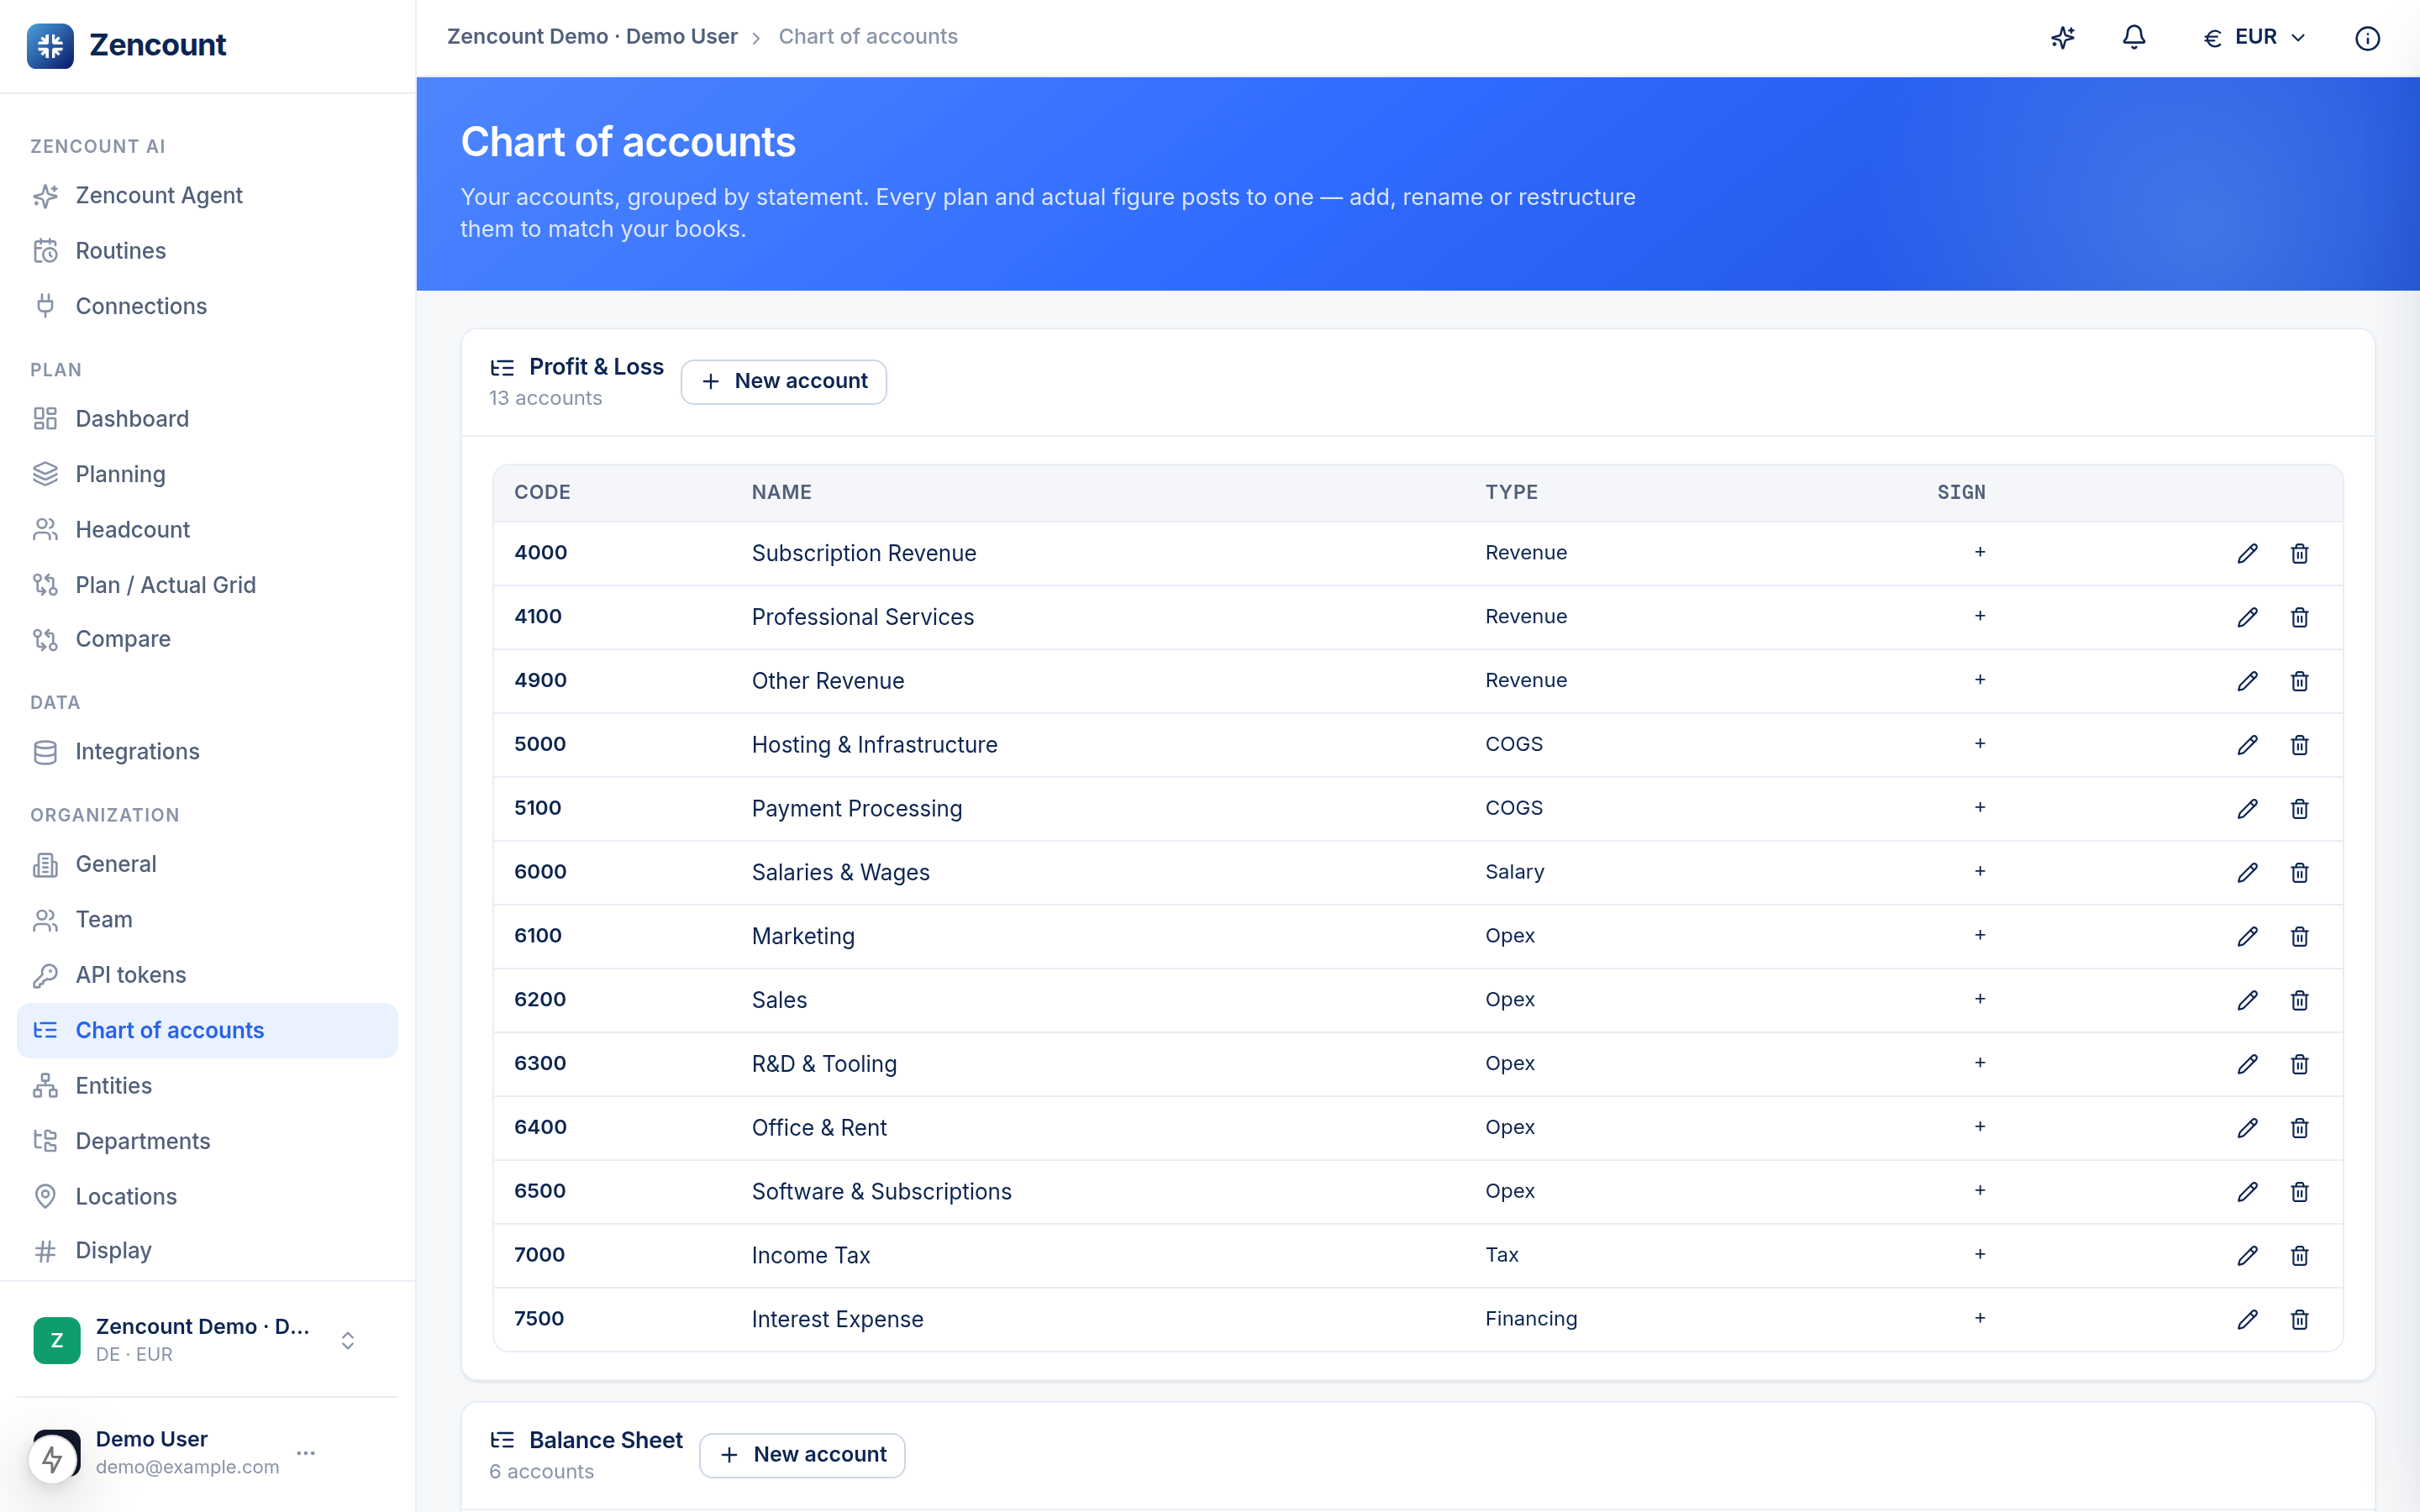
Each account has a type that decides where it rolls up:
- Revenue and Cost of Revenue → Gross profit.
- OpEx (salaries, marketing, sales, R&D, rent, software) → Operating result.
- Tax & Financing → Net result.
Adjusting it
Add, rename or reorder accounts to match how your finance team reads the P&L. The grouping, subtotals and dashboard all follow your structure.
Map an integration’s accounts to these so imported actuals land in the right rows — see Connect a data source.
Next steps
- The planning grid reflects this structure.
- Entities for multi-entity planning.